Documentation
The Admin Dogu is a tool in the Cloudogu EcoSystem for administration and maintenance of Dogus. By offering functionality through a user interface which in other systems is often only accessible through the console, the Admin Dogu allows you as an administrator to manage your Cloudogu EcoSystem with very little effort.
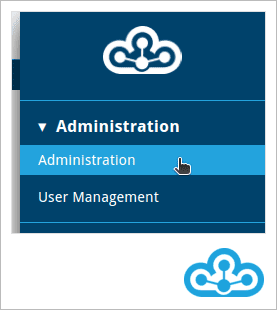
You can reach the Admin Dogu in the Warp menu via the "Administration" entry in the section with the same name. Please note that the Admin Dogu is currently only available with a german interface.
The Admin-Dogu currently offers the following functions:
- Dogu Management
- Maintenance
- Monitoring

Dogu Management
With the Dogu Management you can start, stop and restart Dogus and download the Logs of individual Dogus. You also have the option to change the log level of a individual dogu.
A role with at least read access is required to use the Dogu Management area.
To use the start/stop/restart/log change actions of the Dogu Management area, a role with at least at least write access is required.
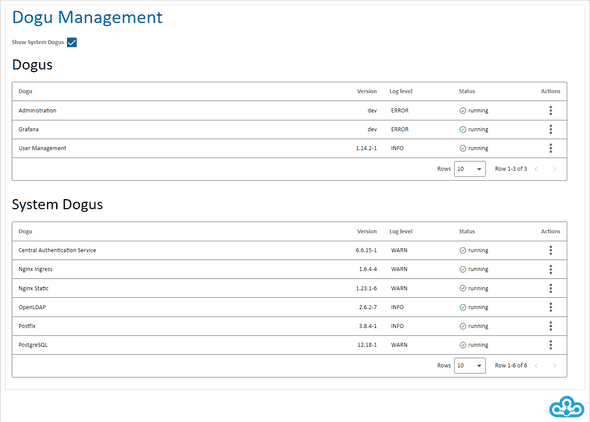
In the default view you can see the Dogus that are accessible via the Warp menu. You can also manage the system components used in the EcoSystem via the Dogu Management. To do this, activate the checkbox System-Dogus einblenden, which will show another table with system components.
In addition to the name, the overview lists further information about a Dogu. This includes the currently installed version, the configured log level and the current status of the Dogu.
If the ecosystem is based on a blueprint, the version of the blueprint is also shown in the Dogu Management.
Change log level
To be able to better analyze the behaviour of a Dogu, you can use the action Change log level to adjust the log level of a specific Dogu. The current log level of a Dogu can be found in the overview section. After you have selected the action Change log level, a dialog will be shown with the log levels to be selected. For this, the options ERROR, WARN, INFO and DEBUG are available, whereby the number of logs to be shown increases from ERROR to DEBUG.
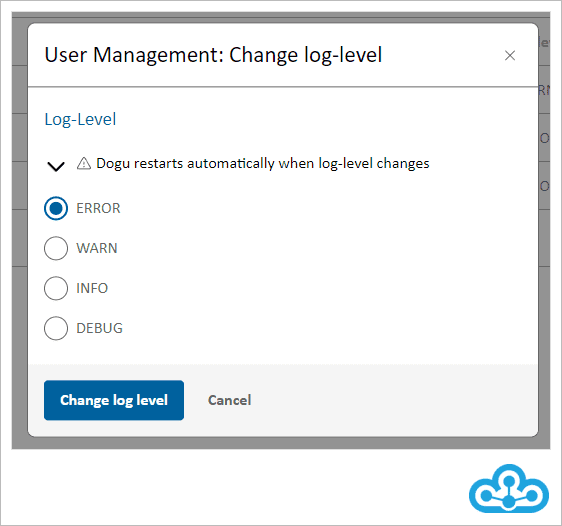
Please note that a restart of the Dogu is required when changing the log level. The restart is carried out automatically when changes are made using the function presented here. It should also be mentioned that more storage is needed when increasing the log level, due to the higher amount of logs to be shown. It is therefore not advisable to set the log level DEBUG for a longer period of time.
Download logs
With the help of the logs, it is possible to trace internal processes or investigate possible errors.
The Dogu Managements area lists all installed Dogus. You have the option of downloading a log file for each Dogu via the Logs herunterladen action. You can access the action by clicking on the three-dot menu in the Aktionen column.

Clicking on Logs herunterladen opens a dialog where you can specify how many lines of the log you want to download.
If the Komplett checkbox is activated, the entire log file is downloaded after confirmation by clicking the Herunterladen button.
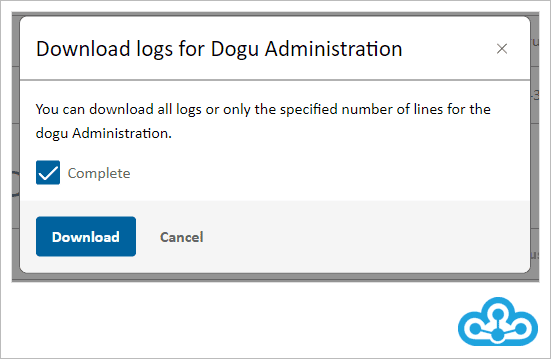
If you deactivate the Komplett checkbox, you can specify the number of the last log lines to be downloaded in the Zeilen field.
If 0 lines are specified, the entire log file is downloaded.
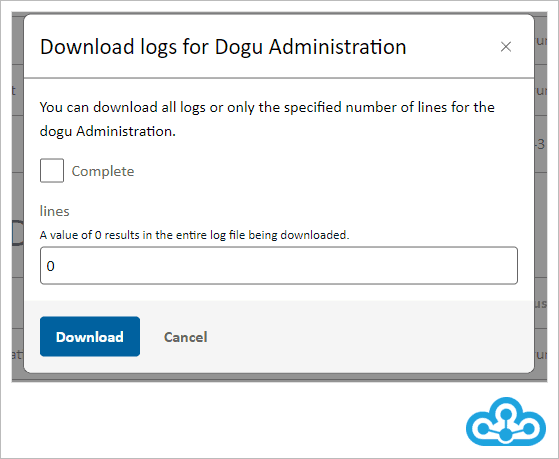
The log file is downloaded as an archive (.zip).
Retrieve logs via API
The logs can also be retrieved via API. A detailed description of the API can be found on your instance under the URL “.../admin/api/v1/spec/en”. Please note that the API for downloading specific log files is only available in the “MultiNode” version of the Cloudogu Ecosystem.
Start, stop and restart
All available Dogus are displayed in Dogu Management.
Under Aktionen you can start, stop or restart each displayed d´Dogu. Only those actions are available that you can currently execute*. For example, you cannot select the *Start action for a currently running Dogu.
If a Dogu or a system component is relevant for the accessibility of the environment, the Stop action is actively prevented. Otherwise, the Dogu would not be able to be restarted via the user interface.
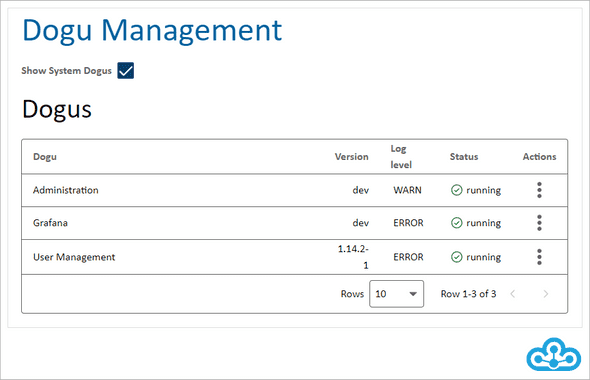
The current status of the Dogu is displayed for each Dogu. The following states are possible for a Dogu:
- running: The Dogu is running and can be reached.
- stopped: The Dogu has been stopped and cannot be reached.
- restarting: The Dogu has recently been restarted and is in the process of starting.
- starting: The Dogu was stopped, was recently started and is in the process of starting.
- stopping: The Dogu was started, was recently stopped and is in the stopping process.
- unknown: There was an error querying the Dogu state.
If you choose to stop or restart a Dogu, you have to confirm the respective action in a dialog box that opens.
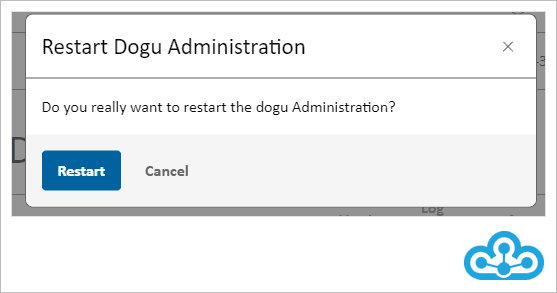
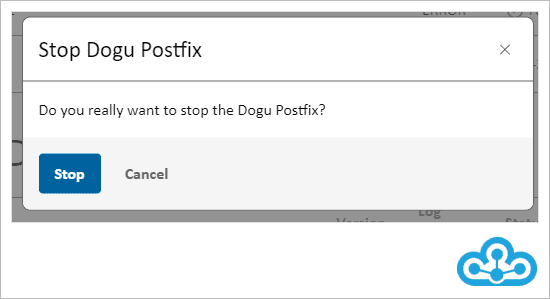
Starting a Dogu does not have to be confirmed again. A successful start, stop or restart of a Dogu is indicated by a success message in the lower part of the screen.
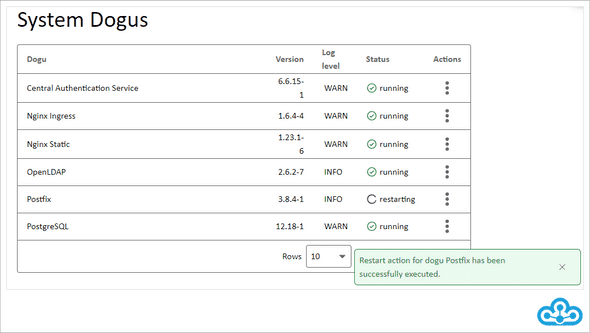
If an error occurs while starting, stopping or restarting a Dogu, this will be indicated with an error message in the lower area.
Maintenance
Using Maintenance, you can enable or disable the debug mode. Additionally, you can create and download a Support Package that contains log files and other relevant information about the system. The Support Package can assist the Cloudogu GmbH support in analyzing problems in the Cloudogu EcoSystem.
A role with write access is required to use the Maintenance section.
For both the debug-mode and the support-package you can find further helpful hints directly next to the functions.
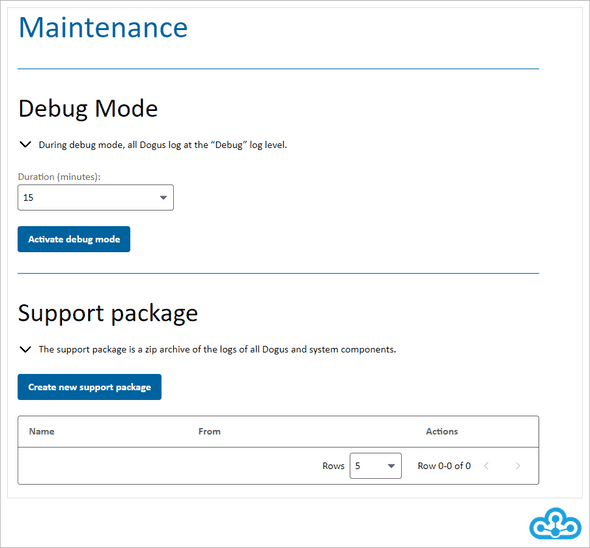
Support package function
With a click on the button Neues Support-Paket erzeugen you can create a new current Support Package. Already created Support Packages can be downloaded directly as an archive (.zip) or deleted here.
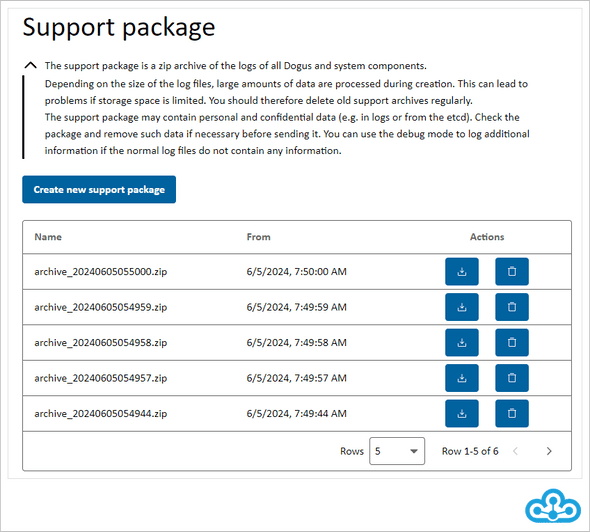
The generated Support Packages are stored in a directory on the host system and can be downloaded again at any time without having to reassemble them.
The support package contains the following information:
-
Configuration
etcd/etcd.tree- All in etcd stored keys as a tree structure (only the keys, no values)etcd/etcd.json- All keys1 and their values in a json file (sensitive keys are excluded).
-
Logs
logs/[servicename].log- The log files of all installed Dogus as well as the services 'syslog', 'cesappd', 'cesapp', 'ces-setup' and 'backup-watcher'.
-
Dogu information
Dogu-information- Information about all installed Dogus, their status (started, stopped, etc.) and the size of their volumes
-
Environmental variables
env- All environmental variables set in the system
-
Process information
process-information- Information about all running processes and services, such as 'cesappd' and the 'backup-watcher'.
-
System information
system-information- Information about the system (installed hardware, operating system, partitions, utilization, memory consumption, installed packages)
-
Volume-information
volume-information- List of the file names of all volumes of the existing Dogus
1 You can exclude values of directories or keys from the etcd/etcd.json file. To do this, you must store the keys in etcd under config/_global/debug/excluded_etcd_keys. In the following example, the config and Dogu_v2 keys are excluded from the etcd/etcd.json file:
config/_global/debug/excluded_etcd_keys/<free-chosen-name-1> => config
config/_global/debug/excluded_etcd_keys/<free-chosen-name-2> => Dogu_v2
In the file etcd/etcd.json the values of both keys are then censored:
{
   "config" : "***",
   "Dogu_v2" : "***"
}
Debug mode function
The Debug mode sets all Dogus to the highest log level (log level = DEBUG), which causes them to output the maximum amount of logs. Therefore, you can use the debug mode for reproducing bugs. Afterwards you can generate the support package with the extended log information.
Note that activating or deactivating the debug mode empties the log files (the old logs are archived in the process). Therefore, you should create a desired support package before deactivating the debug mode. It may also be useful to generate a support package before activating the debug mode as well.
Activating the debug mode is only possible for maximum 60 minutes to avoid problems due to the increased log level; the log level set in debug mode can generate a lot of output, which could cause log files to be several 100 Mb in size.
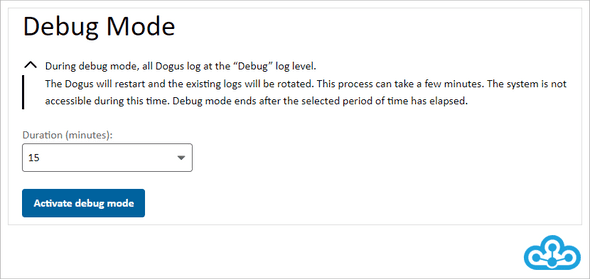
Clicking the Debug-Modus aktivieren button opens a dialog to confirm the operation. Via button Abbrechen you can close the dialog without starting the debug mode.
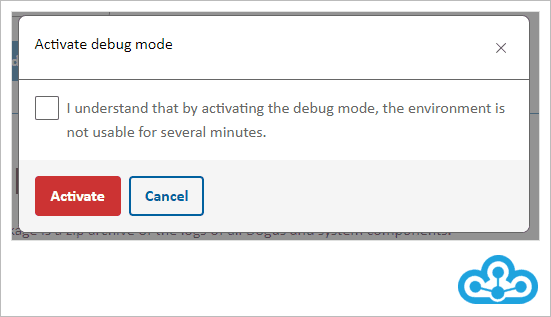
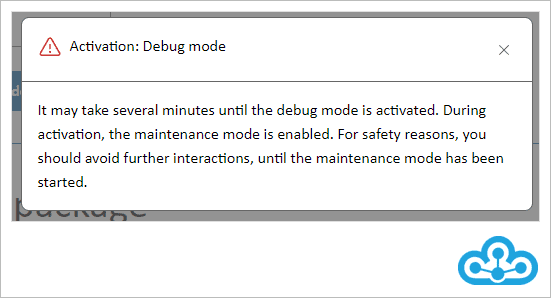
When activating debug mode, please note that the entire system including the Admin Dogus will no longer be accessible via the user interface for several minutes. When activating the debug mode you will also be shown this information.
While the debug mode is activated, the system is put into maintenance mode for a few minutes and the log levels are configured. Maintenance mode is shown to you via a maintenance page when you try to access the environment via the user interface.
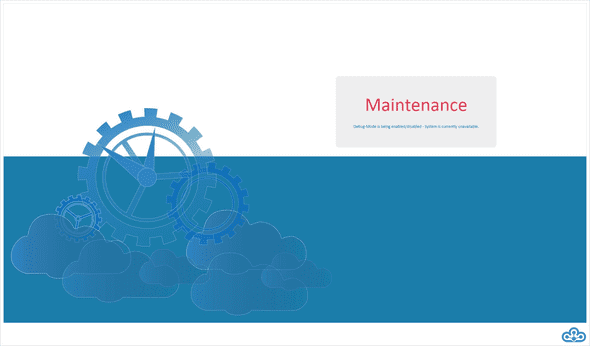
When the maintenance mode is stopped, you need to reload the browser page. The page will not be refreshed automatically.
If the Debug mode is active, you have the option to end the Debug mode with the button Debug-Modus deaktivieren before the set time has elapsed.
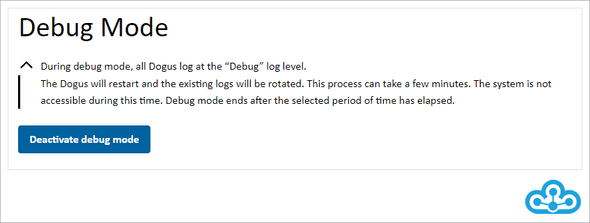
You can see how long the debug mode is still active by a hint below the navigation bar. This is displayed in all areas of the Admin Dogus.

If the deactivation of the debug mode is done in less than five minutes, the label will be highlighted.

You should deactivate the debug mode as soon as you don't need it anymore, for example after you have reproduced the bug and created the support package.
By clicking on Debug-Modus deaktivieren you will again get a dialog confirming that the environment will be unusable for a few minutes. Even when deactivating debug mode, the system will be unavailable for several minutes and will be in maintenance mode.
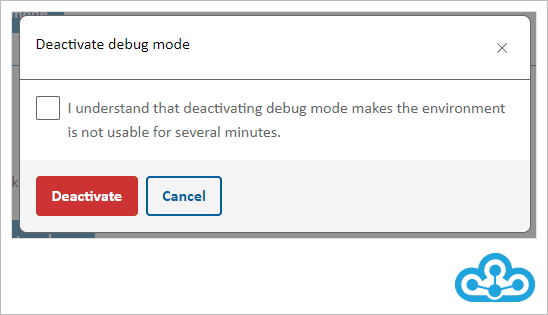
After the confirmation you will be shown this hint as well.
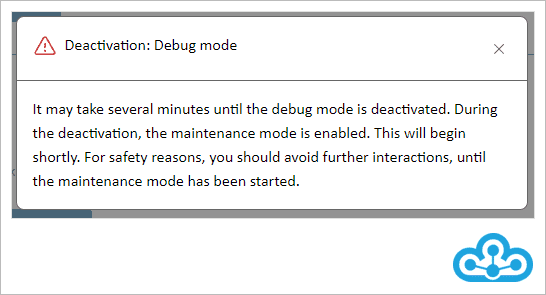
After a successful deactivation of the debug mode you can use the system again as usual.
Monitoring
❗Important❗ The monitoring area is only available in the “MultiNode” version of the Cloudogu Ecosystem!
In the monitoring area of the Admin-Dogu you can view detailed information on the current status and resource consumption of the system. This area integrates a dashboard of the Grafana-Dogu. The displayed data is collected and provided by the CES component k8s-prometheus. For this reason, the monitoring tab is only displayed if both k8s-prometheus and Grafana-Dogu are installed.
Furthermore, registered users must have authorization to access the Grafana-Dogu. The configurations for this can be found in the Grafana-Dogu documentation. If users do not have the necessary authorization, the monitoring tab is also not displayed.
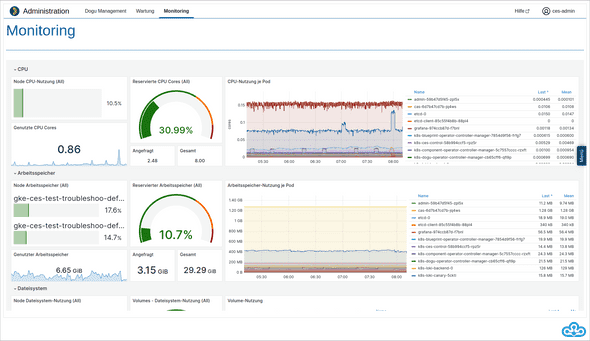
The values of the last 3 hours are displayed. The display is automatically updated every 10 seconds.
The individual visualizations are divided into different groups. A group can be expanded or collapsed by clicking on the group name.
CPU
The “CPU” group shows various metrics on the processor load.

Node CPU usage
"Node CPU usage" shows the current, percentage CPU usage across all nodes of the Kubernetes cluster.
CPU cores in use
"CPU cores in use" shows the number of CPU cores currently in use. This corresponds to the virtual cores of the individual nodes. See CPU resource units
Reserved CPU cores
"Reserved CPU cores" shows the proportion of reserved CPU cores. Individual workloads (e.g. Dogus) can reserve CPU resources to ensure smooth execution. The percentage of reserved CPU cores is shown at the top. Below this, the currently requested and total available CPU cores are shown as absolute values.
CPU usage per pod
This diagram shows the CPU usage of the individual pods over the last 3 hours. The legend on the right-hand side of the diagram contains the name of the pod (Name), the last measured value (Last) and the average value in the period shown (Mean). By clicking on the individual headings of the legend, it can be sorted in ascending or descending order according to the respective column.
Working memory
The “Memory” group shows various metrics on the utilization of the working memory:

Node working memory
"Node working memory" shows the current, percentage utilization of the working memory per node of the Kubernetes cluster.
Memory in use
"Memory in use" shows the amount of RAM currently used across all nodes of the Kubernetes cluster. The usage history of the last 3 hours is displayed in the background.
Reserved working memory
"Reserved working memory" shows the proportion of reserved working memory. Individual workloads (e.g. Dogus) can reserve memory to ensure smooth execution. The percentage of reserved working memory is shown at the top. Below this, the currently requested and total available RAM are shown as absolute values.
Memory usage per pod
This diagram shows the memory usage of the individual pods over the last 3 hours. The legend on the right-hand side of the diagram contains the name of the pod (Name), the last measured value (Last) and the average value in the period shown (Mean). By clicking on the individual headings of the legend, it can be sorted in ascending or descending order according to the respective column.
File system
The “File system” group shows various metrics on the utilization of the file system in the Kubernetes cluster:

Node file system utilization
"Node file system utilization" shows the current, percentage usage of the file system per node of the Kubernetes cluster.
The file system of the individual nodes is considered here. The individual volumes for the persistent storage of workloads can also be made available outside the nodes.
Node file system in use
"Node file system in use" shows the amount of the currently used file system across all nodes of the Kubernetes cluster. The usage history of the last 3 hours is displayed in the background.
Volumes File system usage
"Volumes File system usage" shows the percentage of the file system used across all volumes provided. The upper area shows the percentage of the file system used of all the volumes provided. Below this, the size of the currently used file system of the volumes and the total available size of all provided volumes are shown as absolute values.
Volume usage
This diagram shows the usage of the provided volumes over the last 3 hours. The legend on the right-hand side of the diagram contains the name of the volume (Name), the last measured value (Last) and the average value in the period shown (Mean). By clicking on the individual headings of the legend, it can be sorted in ascending or descending order according to the respective column.
Network
The “Network” group shows various metrics on the utilization of the network of the Kubernetes cluster:

Network I/O per pod (2m average)
This diagram shows the network usage of the individual pods over the last 3 hours.
The usage is divided into incoming and outgoing network traffic.
A 2-minute average is calculated for each data point to provide a better visualization.
The legend on the right-hand side of the diagram contains the name of the pod (Name), the last measured value (Last) and the average value in the period shown (Mean).
By clicking on the individual headings of the legend, it can be sorted in ascending or descending order according to the respective column.
Network I/O (2m average)
This chart contains the total network usage in the Kubernetes cluster over the last 3 hours.
The usage is divided into incoming and outgoing network traffic.
A 2-minute average is calculated for each data point to achieve a better visualization.
The legend on the right-hand side of the diagram contains the traffic kind (Name), the last measured value (Last) and the average value in the period shown (Mean).
By clicking on the individual headings of the legend, it can be sorted in ascending or descending order according to the respective column.
Roles and permissions
Currently there are roles in the Admin Dogu for reading, writing and administrative access to the application functionalities. You can see your assigned role in the navigation bar of the Admin Dogu at the user image left of your own user name.
The roles are predefined by default. However, via the configuration of the Admin Dogu in etcd you can rename them according to your wishes.
bash
cesapp edit-config admin
To assign the required roles to users, manually create the required groups in User Management and assign the users as desired. Note that the groups should have the same name as defined in the Admin Dogus configuration in etcd.
Users without at least one of these roles have no access to the Admin Dogu.
Reading access
Users with this role have access to the Admin Dogu and can mainly view information, but cannot make any settings on the system.
You can configure the role as follows:
bash
config/admin/groups/reader
By default this role is defined as adminReaders.
Write access
Users with this role have access to the Admin Dogu and can additionally modify data via the interface.
You can configure the role as follows:
bash
config/admin/groups/writer
By default this role is defined as adminWriters.
Admin access
Users with this role have access to the Admin Dogu and can use all available functions via the user interface.
In addition to the group configured via config/admin/groups/admin, all users are also granted administrative permissions,
if they have been assigned the general admin group of the Cloudogu EcoSystem via the User Management.
You can configure the role as follows:
bash
config/admin/groups/admin
By default this role is defined as adminAdmins.
Troubleshooting
If the Admin Dogu shows error messages (such as Initialization failed) instead of the installed Dogus, it may be due to an outdated version of the cesappd service.
The Admin Dogu needs a cesappd service at least in version 3.5.1 to work correctly.
You can install a current version of the cesappd service via apt:
shell
apt update && apt install cesappd
If this does not fix the error, you can reinstall the Admin Dogu:
# remove currently installed Dogu
cesapp purge admin && \
# reinstall Dogu from the premium namespace
cesapp install premium/admin && \
# start Dogu
cesapp start admin
The Admin Dogu does not hold any data in a database that could be lost.